Viewing & Managing Requests
View and search all webhook requests across your endpoints with powerful filtering, inspection, and replay capabilities.
What are Requests?
Requests are incoming webhook events captured by your Flow endpoints. Each request contains:
- HTTP Method: POST, GET, PUT, etc.
- Headers: All HTTP headers sent by the source
- Body: The payload (JSON or raw)
- Query Parameters: URL query parameters
- Metadata: Timestamp, endpoint, request ID
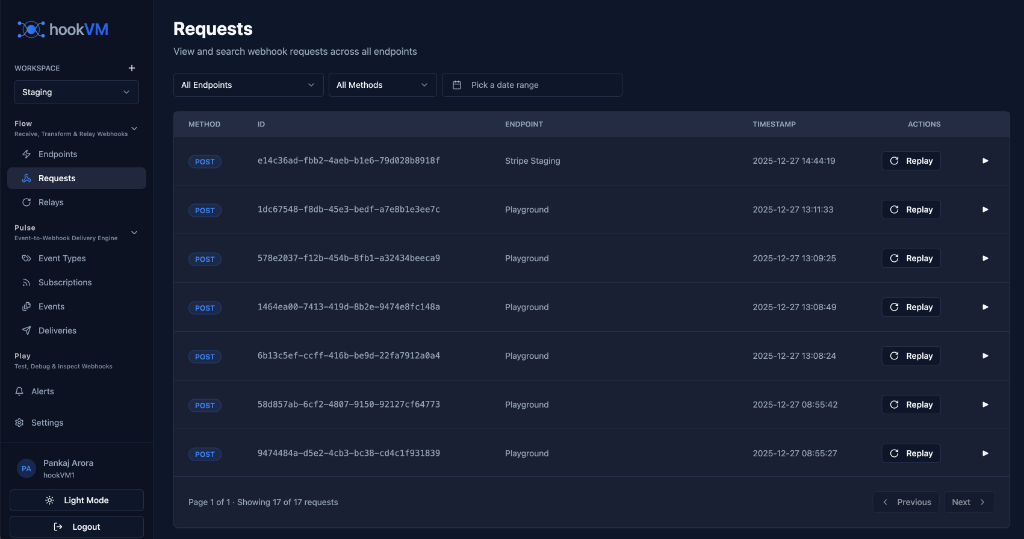
Requests Page
The Requests page provides a centralized view of all webhook requests across all your endpoints.
Key Features
Unified View: See requests from all endpoints in one place
Filtering: Filter by endpoint, method, and date range
Search: Find specific requests by ID
Pagination: Navigate through large volumes of requests
Quick Actions: Replay requests with one click
Detailed Inspection: Expand any request to view full details
Filtering Requests
Use filters to narrow down the requests you want to see.
Filter by Endpoint
Dropdown: "All Endpoints"
Select a specific endpoint to view only its requests:
- All Endpoints (default)
- Stripe Staging
- Playground
- Production API
- Any other endpoint
Use Case: Focus on requests from a specific integration
Filter by Method
Dropdown: "All Methods"
Filter by HTTP method:
- All Methods (default)
- POST
- GET
- PUT
- DELETE
- PATCH
Use Case: Find specific types of requests (e.g., only POST requests)
Filter by Date Range
Date Picker: "Pick a date range"
Select a custom date range to view requests:
- Today
- Last 7 days
- Last 30 days
- Custom range
Use Case: Investigate issues during a specific time period
Request List
View all requests in a table format with key information.
Columns
METHOD: HTTP method (POST, GET, etc.)
- Color-coded badge
- Quick visual identification
ID: Unique request identifier
- Full request ID displayed
- Used for searching and reference
ENDPOINT: Which endpoint received the request
- Endpoint name displayed
- Helps identify the source
TIMESTAMP: When the request was received
- Full date and time
- Format: YYYY-MM-DD HH:MM:SS
ACTIONS: Quick actions for each request
- Replay: Manually replay the request
- Expand: View full request details
Pagination
Navigate through large volumes of requests efficiently.
Display: "Page 1 of 1 - Showing 17 of 17 requests"
Controls:
- Previous: Go to previous page
- Next: Go to next page
- Page number indicator
Items per Page: Configurable (default: 20)
Inspecting Request Details
Click the expand arrow (▼) to view full request details.
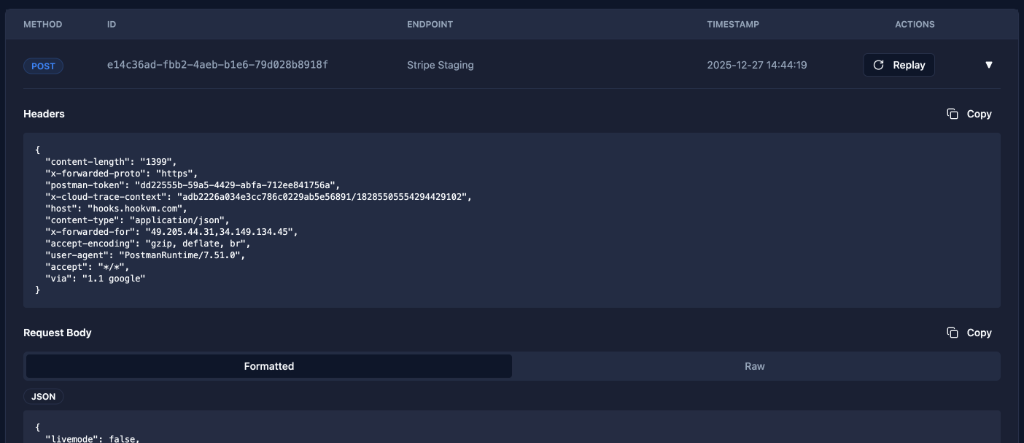
Headers Section
View all HTTP headers sent with the request.
Display: JSON format with syntax highlighting
Common Headers:
{
  "content-length": "1399",
  "x-forwarded-proto": "https",
  "postman-token": "dd22555b-50a3-4429-abfa-732ee84175ea",
  "x-cloud-trace-context": "adb2226d03e53c786c8229ab5e5609/...",
  "host": "hooks.hookvm.com",
  "connection": "Keep-Alive",
  "x-forwarded-for": "49.205.44.31,34.149.134.45",
  "accept-encoding": "gzip, deflate, br",
  "user-agent": "PostmanRuntime/7.51.0",
  "accept": "*/*",
  "via": "1.1 google"
}
Copy Button: Click "Copy" to copy all headers to clipboard
Use Cases:
- Verify authentication headers
- Check signature headers
- Debug routing issues
- Inspect custom headers
Request Body Section
View the webhook payload in formatted or raw view.
Tabs:
- Formatted: Pretty-printed JSON with syntax highlighting
- Raw: Raw text format
Display: JSON format with proper indentation
Example:
{
  "livemode": false,
  "event": "payment_intent.succeeded",
  "data": {
    "id": "pi_123",
    "amount": 9999,
    "currency": "usd"
  }
}
Copy Button: Click "Copy" to copy body to clipboard
Use Cases:
- Inspect payload structure
- Verify data integrity
- Debug transformation issues
- Copy for testing
Query Parameters Section
View URL query parameters (if any).
Display: Key-value pairs
Example:
source: stripe
environment: production
version: v1
Manual Replay
Manually replay a request to configured relay destinations.
How to Replay
- Locate Request: Find the request you want to replay
- Click Replay: Click the "Replay" button in the Actions column
- Confirmation: Request is sent to all configured relay rules
- Monitor: Check relay logs for delivery status
What Happens During Replay
Request Processing:
- Original request is retrieved from storage
- All active relay rules are evaluated
- Filters are applied (if configured)
- Transformations are applied (if configured)
- Request is forwarded to destinations
- Delivery attempts are logged
Replay Behavior:
- Uses the original payload exactly as received
- Applies current relay rules (not rules from original request time)
- Respects filter conditions
- Applies transformations
- Follows retry configuration
Use Cases
Development & Testing:
- Test relay rule changes
- Verify transformation logic
- Test error handling
- Validate destination endpoints
Debugging:
- Reproduce issues
- Test fixes
- Verify signature verification
- Debug payload transformations
Recovery:
- Resend failed requests
- Recover from downtime
- Reprocess after configuration changes
Important Notes
⚠️ Idempotency: Replaying a request sends it again to your destinations. Ensure your systems handle duplicate requests properly using idempotency keys or request IDs.
💡 Current Rules: Replay uses the current relay rules, not the rules that were active when the request was originally received.
🔒 Permissions: Only users with appropriate permissions can replay requests.
Common Workflows
Debugging Failed Deliveries
- Filter by Endpoint: Select the problematic endpoint
- Filter by Date: Choose the time period when failures occurred
- Inspect Request: Expand the request to view details
- Check Headers: Verify signature and authentication headers
- Check Body: Ensure payload is valid
- Replay: Test with current relay rules
Testing Relay Rules
- Find Test Request: Locate a sample request
- Update Relay Rule: Modify filters or transformations
- Replay Request: Click "Replay" to test changes
- Verify Delivery: Check destination received correct data
- Iterate: Adjust rules and replay until correct
Investigating Issues
- Filter by Time: Select date range when issue occurred
- Review Requests: Look for patterns or anomalies
- Inspect Details: Check headers and body for issues
- Copy Data: Copy headers/body for further analysis
- Document: Note request IDs for support tickets
Recovering from Downtime
- Filter by Date: Select the downtime period
- Filter by Endpoint: Choose affected endpoint
- Review Requests: Identify which requests need reprocessing
- Bulk Replay: Replay requests one by one or in batches
- Monitor: Verify successful delivery
Search & Navigation
Search by Request ID
Use the request ID to find a specific request:
- Copy ID: Copy the full request ID from logs or alerts
- Use Browser Search: Use Cmd+F (Mac) or Ctrl+F (Windows)
- Paste ID: Paste the request ID
- Navigate: Browser highlights matching request
Keyboard Shortcuts
Navigation:
↓/↑: Navigate between requestsEnter: Expand/collapse selected requestCmd/Ctrl + F: Search
Actions:
R: Replay selected request (when focused)C: Copy request details
Best Practices
Monitoring
✅ Regular Review: Check requests daily for anomalies
✅ Filter Strategically: Use filters to focus on relevant requests
✅ Note Patterns: Document recurring issues
✅ Set Alerts: Configure alerts for critical endpoints
Debugging
✅ Inspect Headers: Always check signature headers first
✅ Verify Payload: Ensure payload matches expected format
✅ Test Replay: Use replay to test fixes
✅ Document IDs: Keep request IDs for reference
Performance
✅ Use Filters: Don't load all requests at once
✅ Limit Date Range: Use specific date ranges
✅ Archive Old Data: Respect retention settings
✅ Pagination: Navigate page by page
Security
✅ Protect Request IDs: Don't share request IDs publicly
✅ Review Headers: Check for sensitive data in headers
✅ Sanitize Logs: Remove sensitive data before sharing
✅ Access Control: Limit who can replay requests
Retention & Storage
Automatic Cleanup
Requests are automatically deleted after the retention period configured for each endpoint.
Default: 30 days
Range: 1-60 days
Configuration: Set during endpoint creation
Storage Limits
Per Request:
- Headers: Up to 64KB
- Body: Up to 10MB
- Total: Up to 10MB per request
Per Endpoint:
- Unlimited requests (within retention period)
- Subject to plan limits
Troubleshooting
Request Not Appearing
Possible Causes:
- Request outside retention period
- Endpoint filter applied
- Date range filter too narrow
- Signature verification failed (request rejected)
Solutions:
- Clear all filters
- Expand date range
- Check endpoint configuration
- Review signature verification settings
Cannot Replay Request
Possible Causes:
- No active relay rules
- Insufficient permissions
- Request too old (outside retention)
Solutions:
- Verify relay rules exist and are enabled
- Check user permissions
- Ensure request is within retention period
Missing Headers or Body
Possible Causes:
- Request was malformed
- Size limits exceeded
- Storage issue
Solutions:
- Check original request from source
- Verify payload size
- Contact support if persistent
Next Steps
- Relay Rules - Configure automatic forwarding
- Relay Logs - Monitor delivery attempts
Need help? Check our troubleshooting guide or contact support.