Monitoring Relay Logs
Track and monitor all relay delivery attempts with detailed logs, retry timelines, and error information.
What are Relay Logs?
Relay Logs record every attempt to forward a webhook request to your configured destinations. Each log contains:
- Status: Success or failure
- Attempt Count: Number of delivery attempts
- Destination URL: Where the request was sent
- Response Code: HTTP status code received
- Error Details: Failure reasons (if failed)
- Timeline: All retry attempts with timestamps
Relays Page
The Relays page provides a comprehensive view of all relay delivery attempts.
Key Features
Status Tracking: See success/failure at a glance
Retry Timeline: View all delivery attempts
Error Details: Detailed failure information
Filtering: Filter by status, endpoint, date
Pagination: Navigate through large volumes
Quick Debug: Identify issues immediately
Relay Log Columns
STATUS
Indicates whether the relay was successful or failed.
FAILED (Red badge):
- Delivery failed after all retry attempts
- Shows attempt count (e.g., "2 attempts")
- Requires investigation
SUCCESS (Green badge):
- Successfully delivered
- Shows attempt count if retried
- No action needed
Color Coding:
- 🔴 Red: Failed
- 🟢 Green: Success
- 🟡 Yellow: Retrying (in progress)
ENDPOINT
The endpoint that received the original webhook request.
Examples:
- Stripe Staging
- Production API
- GitHub Events
- Playground
Use Case: Identify which integration is having issues
DESTINATION URL
The external URL where the webhook was forwarded.
Format: Full URL including protocol
Examples:
https://api.yourapp.com/webhooks
https://staging.yourapp.com/webhooks/stripe
https://wrongendpoint/error
Use Case: Verify correct destination configuration
TIME RANGE
The time period of all delivery attempts.
Format:
First: YYYY-MM-DD HH:MM:SS
Last: YYYY-MM-DD HH:MM:SS
Example:
First: 2025-12-27 15:16:22
Last: 2025-12-27 15:16:24
Use Case: Understand retry timing and duration
FINAL CODE
The HTTP status code from the last delivery attempt.
Common Codes:
200: Success201: Created (success)400: Bad Request (client error)401: Unauthorized404: Not Found500: Internal Server Error502: Bad Gateway503: Service Unavailable504: Gateway Timeout
Empty: No response received (network error)
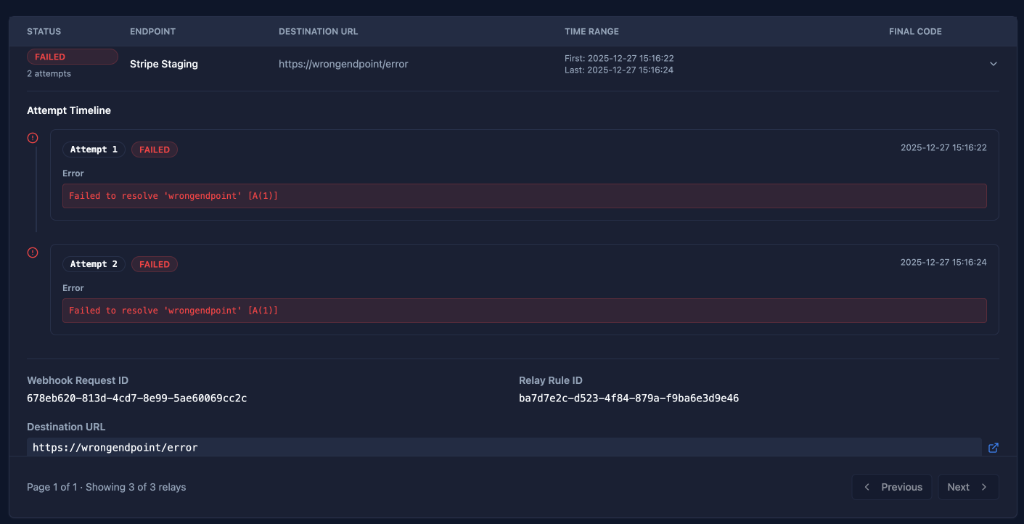
Attempt Timeline
Expand any relay log to see the detailed attempt timeline.
Timeline View
Shows all delivery attempts in chronological order.
Attempt 1 - FAILED - 2025-12-27 15:16:22
Error
Failed to resolve 'wrongendpoint' [A(1)]
Attempt 2 - FAILED - 2025-12-27 15:16:24
Error
Failed to resolve 'wrongendpoint' [A(1)]
Attempt Information
Each attempt shows:
- Attempt Number: Sequential number (1, 2, 3...)
- Status: FAILED or SUCCESS
- Timestamp: Exact time of attempt
- Error Message: Detailed error (if failed)
- Response Code: HTTP status (if received)
Error Types
Network Errors
DNS Resolution Failure:
Failed to resolve 'wrongendpoint' [A(1)]
Cause: Invalid domain name or DNS issue
Solution: Verify destination URL is correct
Connection Timeout:
Connection timed out after 30000ms
Cause: Destination not responding
Solution: Check destination is online and accessible
Connection Refused:
Connection refused
Cause: Destination actively refusing connections
Solution: Verify destination is running and accepting connections
HTTP Errors
4xx Client Errors:
HTTP 400: Bad Request
HTTP 401: Unauthorized
HTTP 404: Not Found
Cause: Request issue or authentication problem
Solution: Check payload format, authentication headers
5xx Server Errors:
HTTP 500: Internal Server Error
HTTP 502: Bad Gateway
HTTP 503: Service Unavailable
Cause: Destination server issue
Solution: Check destination server logs, contact destination team
SSL/TLS Errors
Certificate Errors:
SSL certificate verification failed
Cause: Invalid or expired SSL certificate
Solution: Update destination SSL certificate
Relay Log Details
Webhook Request ID
The unique identifier of the original webhook request.
Format: 678eb620-813d-4cd7-8e99-5ae68069cc2c
Use Case:
- Cross-reference with Requests page
- Track request through entire flow
- Debug end-to-end delivery
Relay Rule ID
The unique identifier of the relay rule that processed this request.
Format: ba7d7e2c-d523-4f84-879a-f9ba6e3d9e46
Use Case:
- Identify which relay rule is failing
- Track rule-specific issues
- Audit rule performance
Destination URL
Full destination URL (repeated for reference).
Link Icon: Click to open destination URL in new tab
Use Case: Quick access to destination for testing
Pagination
Navigate through relay logs efficiently.
Display: "Page 1 of 1 - Showing 3 of 3 relays"
Controls:
- Previous: Go to previous page
- Next: Go to next page
- Page indicator
Filtering Relay Logs
Use filters to narrow down relay logs (filters shown in UI).
Filter by Status
Options:
- All Statuses
- Success
- Failed
- Retrying
Use Case: Focus on failed deliveries for troubleshooting
Filter by Endpoint
Options:
- All Endpoints
- Specific endpoint name
Use Case: Investigate issues with specific integration
Filter by Date Range
Date Picker: Select custom date range
Use Case: Investigate issues during specific time period
Common Workflows
Debugging Failed Deliveries
- Filter by Failed: Show only failed relay logs
- Expand Log: Click to view attempt timeline
- Review Errors: Check error messages for each attempt
- Identify Pattern: Look for consistent error types
- Fix Issue: Update destination or relay rule
- Test: Replay original request to verify fix
Monitoring Success Rates
- View All Logs: Don't apply status filter
- Count Failures: Note number of failed vs successful
- Identify Trends: Look for increasing failure rates
- Investigate: Expand failed logs to find root cause
- Alert: Set up monitoring for critical endpoints
Tracking Retry Behavior
- Expand Log: View attempt timeline
- Check Timing: Note time between attempts
- Verify Backoff: Confirm exponential backoff
- Review Final Attempt: Check if all retries exhausted
- Adjust Config: Update retry settings if needed
Cross-Referencing Requests
- Copy Request ID: From relay log details
- Go to Requests: Navigate to Requests page
- Search: Find request by ID
- Compare: Verify request payload vs relay error
- Debug: Identify transformation or filter issues
Understanding Retry Behavior
Retry Strategy
hookVM uses exponential backoff for retries:
Attempt 1: Immediate
Attempt 2: After 1 second (1000ms backoff)
Attempt 3: After 2 seconds (2000ms backoff)
Attempt 4: After 4 seconds (4000ms backoff)
When Retries Occur
Retried:
- 5xx server errors
- Network timeouts
- Connection failures
- DNS resolution failures
Not Retried:
- 2xx success codes
- 4xx client errors (bad request, unauthorized, etc.)
- Invalid relay rule configuration
Maximum Attempts
Configured per relay rule (default: 3 attempts).
Example Timeline:
Attempt 1: 15:16:22 - FAILED
Attempt 2: 15:16:24 - FAILED (2s later)
Attempt 3: 15:16:28 - FAILED (4s later)
Final Status: FAILED after 3 attempts
Best Practices
Monitoring
✅ Regular Review: Check relay logs daily
✅ Set Alerts: Configure alerts for high failure rates
✅ Track Patterns: Note recurring errors
✅ Document Issues: Keep log of common problems
Debugging
✅ Check Errors First: Start with error messages
✅ Verify Destination: Test destination URL manually
✅ Review Timeline: Understand retry behavior
✅ Cross-Reference: Link to original request
Performance
✅ Filter Strategically: Use filters to reduce load
✅ Limit Date Range: Don't load all historical logs
✅ Archive Data: Export old logs if needed
✅ Monitor Trends: Track success rates over time
Troubleshooting
✅ DNS Errors: Verify destination URL spelling
✅ Timeouts: Check destination response time
✅ 4xx Errors: Review payload and authentication
✅ 5xx Errors: Contact destination team
Common Error Solutions
"Failed to resolve 'wrongendpoint'"
Problem: Invalid domain name
Solutions:
- Check destination URL in relay rule
- Verify domain spelling
- Ensure domain exists and is accessible
- Test URL in browser
"Connection timed out"
Problem: Destination not responding within timeout
Solutions:
- Verify destination is online
- Check firewall rules
- Increase timeout in relay rule (if available)
- Contact destination team
"HTTP 401: Unauthorized"
Problem: Authentication failed
Solutions:
- Verify authentication headers in relay rule
- Check API key or token is valid
- Ensure signature is enabled if required
- Test authentication manually
"HTTP 500: Internal Server Error"
Problem: Destination server error
Solutions:
- Check destination server logs
- Verify payload format
- Test with smaller payload
- Contact destination team
Retention & Storage
Log Retention
Relay logs are stored for the same period as webhook requests.
Default: 30 days
Range: 1-60 days
Configuration: Set per endpoint
Storage Limits
Per Relay Log:
- Error messages: Up to 4KB
- Attempt details: All attempts stored
- Total: Minimal storage per log
Troubleshooting
Relay Log Not Appearing
Possible Causes:
- No relay rules configured
- Relay rule disabled
- Request filtered out
- Outside retention period
Solutions:
- Verify relay rule exists and is enabled
- Check filter conditions
- Expand date range
- Review relay rule configuration
All Attempts Failing
Possible Causes:
- Destination URL incorrect
- Destination offline
- Authentication issue
- Payload format issue
Solutions:
- Test destination URL manually
- Verify destination is accessible
- Check authentication headers
- Review transformation script
Retries Not Happening
Possible Causes:
- Retry count set to 0
- 4xx error (no retry)
- Relay rule disabled
Solutions:
- Check retry count in relay rule
- Review error type (4xx vs 5xx)
- Verify rule is enabled
Next Steps
- Relay Rules - Configure relay rules
- Viewing Requests - View original requests
Need help debugging? Check our troubleshooting guide or contact support.