Monitoring Deliveries
Track individual webhook delivery attempts to subscriber endpoints and monitor delivery success rates.
What are Deliveries?
Deliveries are individual attempts to send a webhook to a subscriber's endpoint. When you send an event, hookVM creates a delivery for each active subscription listening to that event type.
Delivery Flow:
- Event is sent
- Matching subscriptions are found
- Delivery is created for each subscription
- Webhook is sent to subscriber endpoint
- Response is recorded
- Retries occur if needed
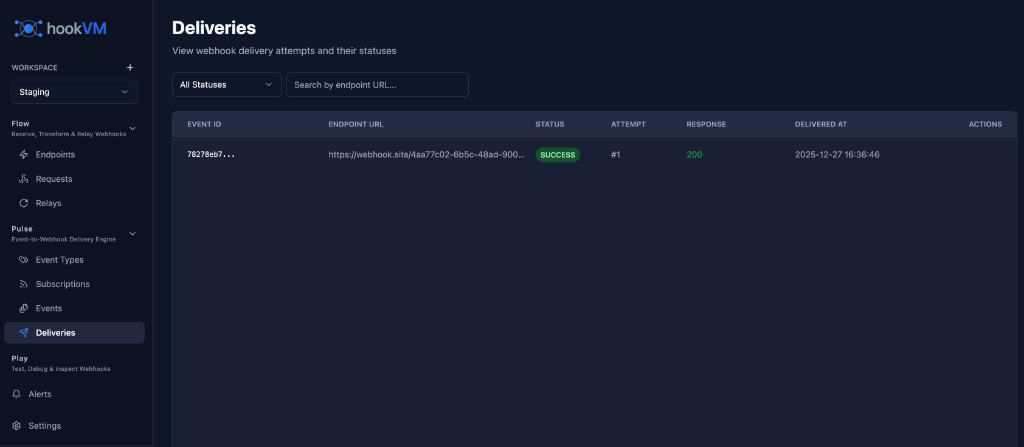
Deliveries Page
View and monitor all webhook delivery attempts and their statuses.
Key Features
Delivery Tracking: See all delivery attempts
Status Monitoring: Track success/failure
Response Codes: View HTTP response codes
Attempt Tracking: See retry attempts
Filtering: Filter by status, endpoint
Debugging: Identify delivery issues
Delivery Columns
EVENT ID
The unique identifier of the event that was delivered.
Format: Truncated ID (e.g., 78278cb7...)
Use Cases:
- Link to original event
- Track event lifecycle
- Debug event-specific issues
ENDPOINT URL
The subscriber's webhook URL where the delivery was attempted.
Format: Full HTTPS URL (truncated for display)
Example:
https://webhook.site/4ap7c02-6b5c-48ad-906...
Use Cases:
- Identify which subscriber
- Verify correct endpoint
- Debug endpoint-specific issues
STATUS
Delivery status indicating success or failure.
SUCCESS (Green badge):
- Webhook delivered successfully
- Received 2xx response code
- No retries needed
FAILED (Red badge):
- Delivery failed
- After all retry attempts
- Requires investigation
PENDING (Yellow badge):
- Delivery in progress
- Waiting for response
- May still succeed
RETRYING (Orange badge):
- Previous attempt failed
- Retry in progress
- Will retry based on config
ATTEMPT
Which delivery attempt this represents.
Format: #{number}
Examples:
#1- First attempt (immediate)#2- Second attempt (after retry)#3- Third attempt (after second retry)
Use Cases:
- Track retry behavior
- Identify persistent failures
- Understand delivery timeline
RESPONSE
HTTP response code from the subscriber's endpoint.
Format: 3-digit HTTP status code
Success Codes (2xx):
200- OK (success)201- Created (success)202- Accepted (success)204- No Content (success)
Client Error Codes (4xx):
400- Bad Request401- Unauthorized403- Forbidden404- Not Found422- Unprocessable Entity
Server Error Codes (5xx):
500- Internal Server Error502- Bad Gateway503- Service Unavailable504- Gateway Timeout
No Response:
- Empty - Network error, timeout, or DNS failure
DELIVERED AT
Timestamp when the delivery attempt was made.
Format: YYYY-MM-DD HH:MM:SS
Example: 2025-12-27 16:36:46
Use Cases:
- Track delivery timing
- Identify delays
- Debug timing issues
ACTIONS
Quick actions for each delivery.
View Details (Eye icon):
- View full delivery details
- See request/response
- Review headers and body
Filtering Deliveries
Use filters to find specific deliveries quickly.
Filter by Status
Dropdown: "All Statuses"
Options:
- All Statuses
- Success
- Failed
- Pending
- Retrying
Use Case: Focus on failed deliveries for troubleshooting
Search by Endpoint URL
Search Box: "Search by endpoint URL..."
Type to search for deliveries to specific endpoints.
Use Case: Find all deliveries to a customer's endpoint
Understanding Delivery Status
Success (2xx Responses)
Status: SUCCESS
Response: 200, 201, 202, 204
Meaning: Webhook delivered successfully
Action: None needed
What Happens:
- Delivery marked as complete
- No retries attempted
- Subscriber received webhook
Client Errors (4xx Responses)
Status: FAILED
Response: 400, 401, 403, 404, 422
Meaning: Subscriber rejected the webhook
Action: Fix subscriber endpoint or payload
What Happens:
- Delivery marked as failed
- No retries (client error)
- Requires manual intervention
Common Causes:
- Invalid payload format (400)
- Missing authentication (401)
- Endpoint not found (404)
- Validation error (422)
Server Errors (5xx Responses)
Status: RETRYING → FAILED
Response: 500, 502, 503, 504
Meaning: Subscriber's server error
Action: Wait for retries or contact subscriber
What Happens:
- Delivery retried automatically
- Exponential backoff applied
- Marked as failed after max retries
Common Causes:
- Subscriber server down (503)
- Timeout (504)
- Internal error (500)
- Gateway issue (502)
Network Errors
Status: RETRYING → FAILED
Response: (empty)
Meaning: Network connectivity issue
Action: Verify endpoint URL and accessibility
What Happens:
- Delivery retried automatically
- Exponential backoff applied
- Marked as failed after max retries
Common Causes:
- DNS resolution failure
- Connection timeout
- Connection refused
- Network unreachable
Retry Behavior
Retry Strategy
hookVM uses exponential backoff for retries:
Attempt 1: Immediate
Attempt 2: After 1 second (1000ms backoff)
Attempt 3: After 2 seconds (2000ms backoff)
Attempt 4: After 4 seconds (4000ms backoff)
Attempt 5: After 8 seconds (8000ms backoff)
When Retries Occur
Retried:
- 5xx server errors
- Network timeouts
- Connection failures
- DNS resolution failures
Not Retried:
- 2xx success codes
- 4xx client errors
- Invalid endpoint URL
Maximum Attempts
Configured per subscription (default: 3 attempts).
Example Timeline:
Attempt 1: 16:36:46 - FAILED (500)
Attempt 2: 16:36:47 - FAILED (500) [1s later]
Attempt 3: 16:36:49 - FAILED (500) [2s later]
Final Status: FAILED after 3 attempts
Viewing Delivery Details
Click on any delivery to view full details.
Request Information
Headers:
{
  "Content-Type": "application/json",
  "X-HookVM-Signature": "t=1640000000,v1=abc123...",
  "X-HookVM-Event-ID": "evt_abc123",
  "X-HookVM-Event-Type": "order.shipped",
  "User-Agent": "HookVM-Webhooks/1.0"
}
Body:
{
  "event_id": "evt_abc123",
  "event_type": "order.shipped",
  "occurred_at": "2025-12-27T10:00:00Z",
  "data": {
    "order_id": "ord_12345",
    "tracking_number": "TRK789",
    "carrier": "UPS"
  }
}
Response Information
Status Code: 200
Response Time: 245ms
Response Headers:
{
  "Content-Type": "application/json",
  "X-Request-ID": "req_xyz789"
}
Response Body:
{
  "success": true,
  "message": "Webhook received"
}
Common Workflows
Debugging Failed Deliveries
- Filter by Failed: Show only failed deliveries
- Check Response Code: Identify error type
- View Details: Inspect request/response
- Identify Pattern: Look for common issues
- Fix Issue: Update endpoint or contact subscriber
Monitoring Subscriber Health
- Search by Endpoint: Find subscriber's deliveries
- Check Success Rate: Count success vs failures
- Review Response Times: Identify slow endpoints
- Alert on Failures: Set up monitoring alerts
Investigating Delays
- Filter by Date: Select time period
- Review Timestamps: Check delivery timing
- Check Attempts: See retry delays
- Identify Bottlenecks: Find slow subscribers
Verifying Delivery
- Search by Event ID: Find event's deliveries
- Check Status: Verify all succeeded
- Review Responses: Confirm subscriber received
- Cross-Reference: Match with subscriber logs
Delivery Metrics
Success Rate
Calculate delivery success rate:
Success Rate = (Successful Deliveries / Total Deliveries) × 100%
Example:
Successful: 950
Failed: 50
Total: 1000
Success Rate: 95%
Average Response Time
Track subscriber endpoint performance:
Avg Response Time = Sum of Response Times / Number of Deliveries
Benchmarks:
- Fast: < 200ms
- Normal: 200-500ms
- Slow: 500-1000ms
- Very Slow: > 1000ms
Retry Rate
Track how often retries are needed:
Retry Rate = (Deliveries with Retries / Total Deliveries) × 100%
Example:
Deliveries with Retries: 100
Total Deliveries: 1000
Retry Rate: 10%
Best Practices
Monitoring
✅ Check Daily: Review failed deliveries
✅ Track Trends: Monitor success rates over time
✅ Set Alerts: Alert on high failure rates
✅ Review Slow Endpoints: Identify performance issues
Debugging
✅ Check Response Codes: Start with HTTP status
✅ Review Payloads: Verify data format
✅ Test Endpoints: Manually test subscriber URLs
✅ Contact Subscribers: Notify of persistent issues
Performance
✅ Monitor Response Times: Track endpoint speed
✅ Identify Bottlenecks: Find slow subscribers
✅ Optimize Payloads: Keep data minimal
✅ Batch When Possible: Reduce delivery volume
Reliability
✅ Configure Retries: Set appropriate retry counts
✅ Monitor Retry Rates: Track retry frequency
✅ Handle 4xx Errors: Fix client errors quickly
✅ Coordinate with Subscribers: Ensure endpoint health
Troubleshooting
All Deliveries Failing
Possible Causes:
- Subscriber endpoint down
- Invalid endpoint URL
- Network issues
- Authentication problems
Solutions:
- Test endpoint with curl
- Verify endpoint URL is correct
- Check network connectivity
- Verify authentication headers
High Retry Rate
Possible Causes:
- Subscriber endpoint unstable
- Timeouts
- Intermittent errors
Solutions:
- Contact subscriber about stability
- Increase timeout settings
- Review subscriber logs
- Consider reducing retry count
Slow Deliveries
Possible Causes:
- Subscriber endpoint slow
- Large payloads
- Network latency
Solutions:
- Monitor response times
- Optimize payload size
- Contact subscriber about performance
- Consider timeout adjustments
Missing Deliveries
Possible Causes:
- No active subscriptions
- Event type mismatch
- Subscription disabled
Solutions:
- Verify subscriptions exist
- Check event types match
- Ensure subscriptions are enabled
API Access
Access delivery data programmatically.
List Deliveries
curl -X GET "https://api.hookvm.com/v1/deliveries?status=failed&limit=100" \
  -H "Authorization: Bearer YOUR_API_KEY"
Get Delivery Details
curl -X GET "https://api.hookvm.com/v1/deliveries/del_abc123" \
  -H "Authorization: Bearer YOUR_API_KEY"
Filter by Event
curl -X GET "https://api.hookvm.com/v1/events/evt_abc123/deliveries" \
  -H "Authorization: Bearer YOUR_API_KEY"
Next Steps
- Event Types - Define event types
- Subscriptions - Manage subscriptions
- Sending Events - Send events to subscribers
Monitor your deliveries to ensure reliable webhook delivery to all subscribers! 📊